function_name <- function(){
  # stuff the function does goes in here
}functions
Creating a simple function
In R, everything is either an object or a function. We have experimented with data simulation and data creation, so we have created our own objects. However, we have not yet created our own functions. In this session, we will explore the basics of creating our own functions in R.
To create a function in R, you create a new function by assigning a name to a function() call, and then defining the function arguments and telling the function what to do.
The basic structure of a function is this:
Note the two curly braces: { and } - these define the start and the end of the function and what it will do. You can include anything you want inside the function, including creating objects and using other functions.
hello world function
Using the framework above, we can create a function named hello.world that will print “Hello World” to the console when it is used.
Note - the cell below creates the function, but it does not actually yet perform or run the function.
hello.world <- function(){
  print("Hello World")
}
To run your function, you need to type the function name and then include the brackets at the end, just like any other function.
# what a useless function!
hello.world()
[1] "Hello World"Adding arguments to your function
The hello.world function above does not have any arguments, but we can change that. When you define your function, you can also define the number of arguments it takes, their names, and whether they have default values.
For example, here is a function with one argument that has a default, and one argument without a default value.
function_name <- function(argument1 = default, argument2){
  # stuff the function does goes in here
}
printer function
Let’s make a function named printer which takes one argument named input with the default value “need input”.
Inside your function, ask it to print the argument words.
printer <- function(words = "need input"){
  print(words)
}
Call your printer function without supplying an argument. What happens?
printer()[1] "need input"Now call printer, but this time give it some input for the words argument.
printer(words = 'Hello World')[1] "Hello World"printer(1234)[1] 1234repeating ourselves
One of the benefits behind creating a function is that you can then more easily perform the same operation many times, usually on different sets of data.
Let’s think about how to do this within the context of plotting something.
Of course, we are going to need some data! Let’s load in tidyverse and some data used in a prior study of satirical and non-satirical newspaper headlines.
library(tidyverse)── Attaching core tidyverse packages ──────────────────────── tidyverse 2.0.0 ──
✔ dplyr 1.1.4 ✔ readr 2.1.5
✔ forcats 1.0.0 ✔ stringr 1.5.1
✔ ggplot2 3.5.1 ✔ tibble 3.2.1
✔ lubridate 1.9.3 ✔ tidyr 1.3.1
✔ purrr 1.0.2
── Conflicts ────────────────────────────────────────── tidyverse_conflicts() ──
✖ dplyr::filter() masks stats::filter()
✖ dplyr::lag() masks stats::lag()
ℹ Use the conflicted package (<http://conflicted.r-lib.org/>) to force all conflicts to become errorsraw_dat <- read_csv('https://raw.githubusercontent.com/scskalicky/scskalicky.github.io/refs/heads/main/sample_dat/linguistic_features.csv')Rows: 80 Columns: 19
── Column specification ────────────────────────────────────────────────────────
Delimiter: ","
chr (3): headline, filename, condition
dbl (16): conditionNum, MLC, numContenWords, numWords, numFunctionWords, MRC...
ℹ Use `spec()` to retrieve the full column specification for this data.
ℹ Specify the column types or set `show_col_types = FALSE` to quiet this message.Now, trim the data to include just a specific set of columns:
dat <- raw_dat %>%
  select(filename, ends_with("CS"))
Let’s say we want to make a density plot of each of the variables ending in “CS”
First, let’s remind ourselves how we might make the most basic of a density plot:
ggplot(dat, aes(x = funnyCS)) +
  geom_density()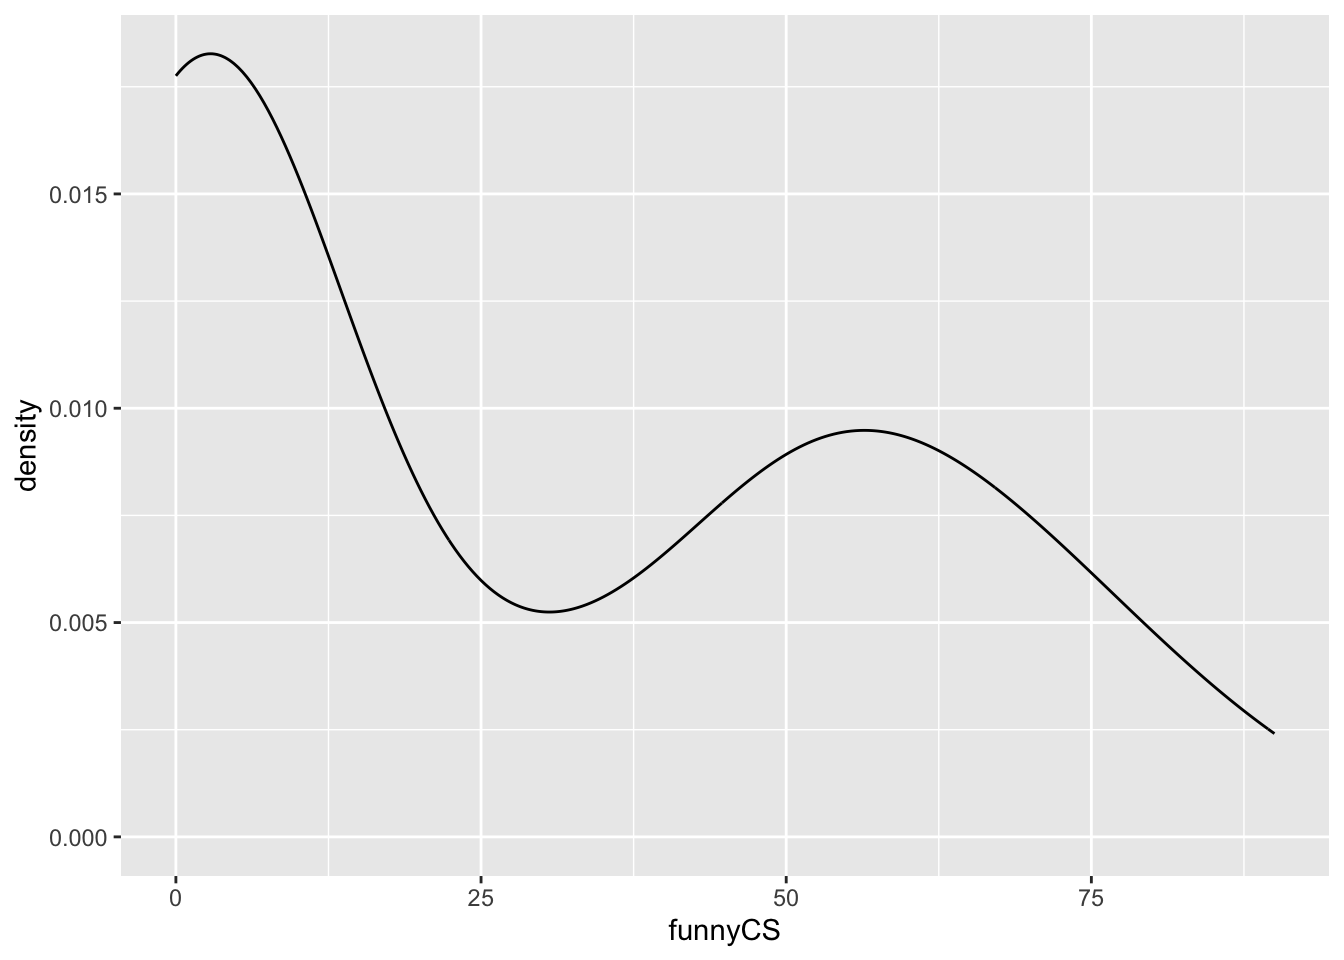
If we wanted to do that for every variable, we could very easily copy and paste the cell and change the name of the variable each time to create many different plots.
However, lets think about doing this within our own function:
my_density_plotter <- function(df, x) {
  # create a simple density plot
  ggplot(df, aes(x = x)) +
    geom_density()
}
Now I provide the name of the data and the name of the column to the function. I have to use the $ indexing of the variable name in order to supply a valid object to the function (try running the function with just the name of the column - what error do you get?)
my_density_plotter(dat, dat$funnyCS)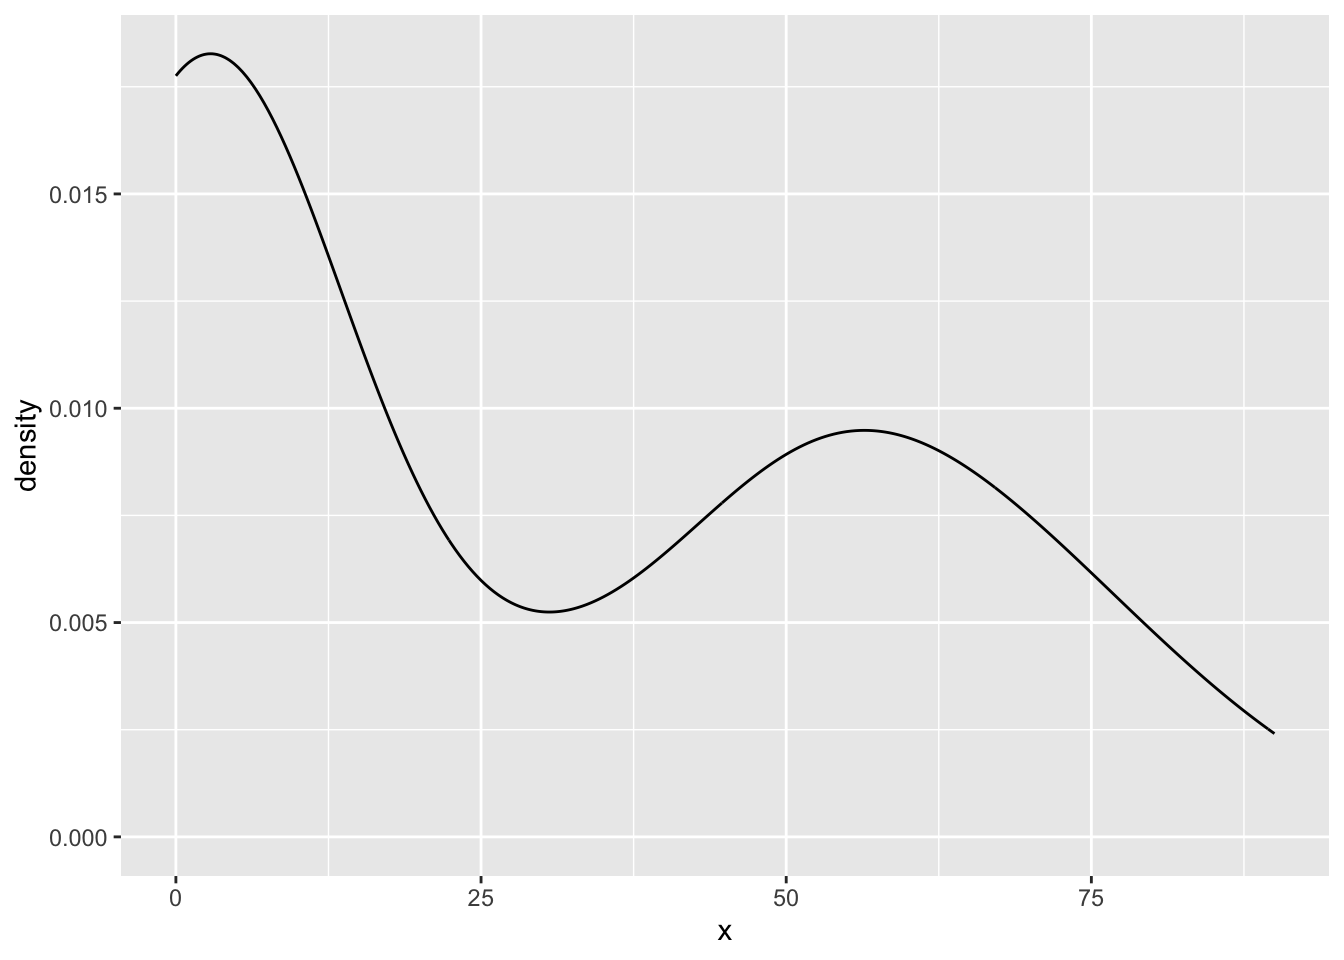
So, great! We could now use this function multiple times for each variable:
my_density_plotter(dat, dat$funnyCS)
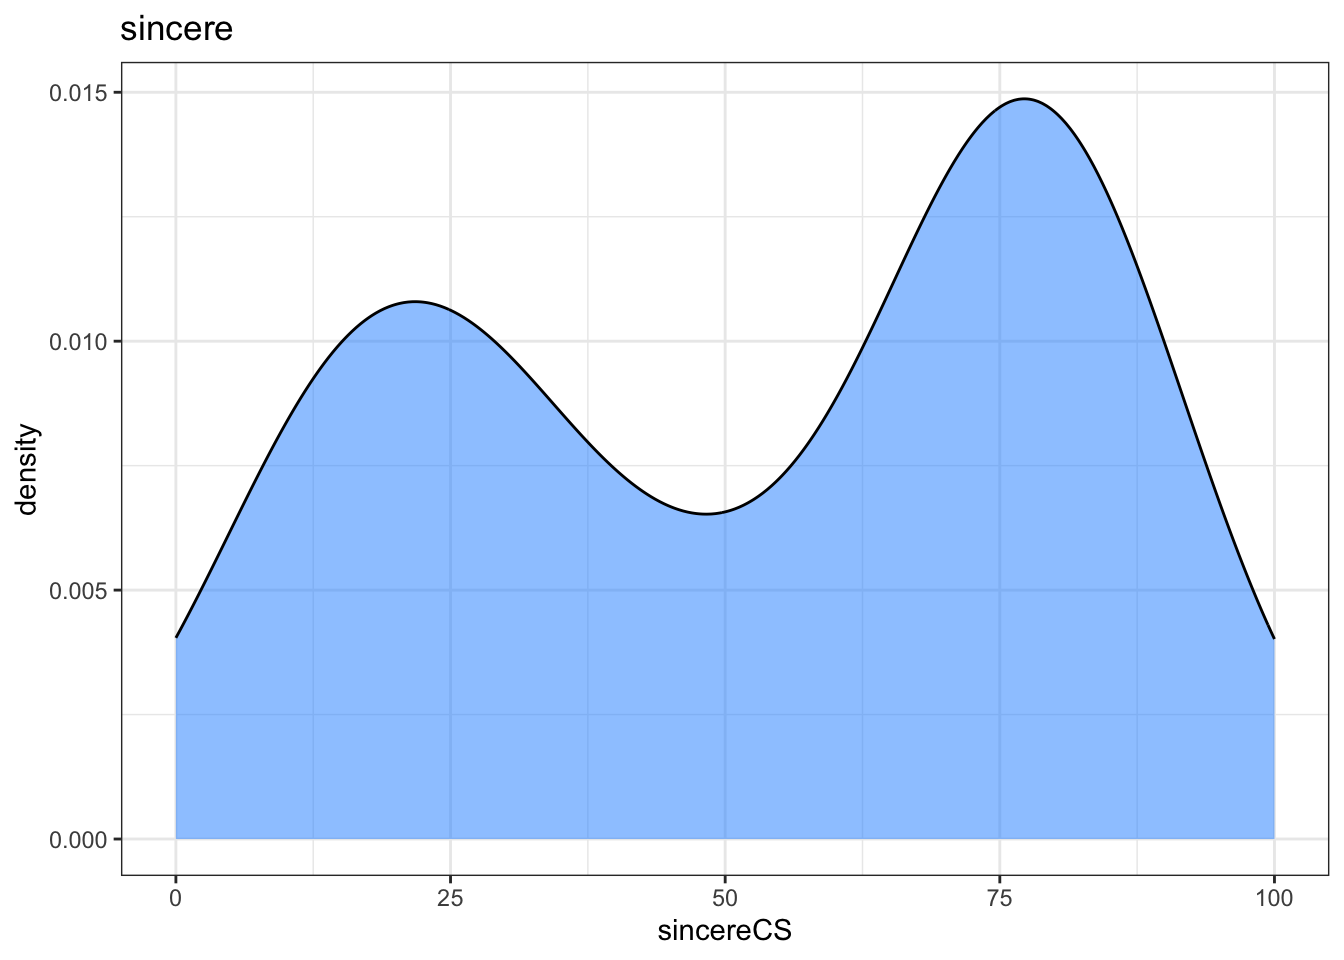
my_density_plotter(dat, dat$sincereCS)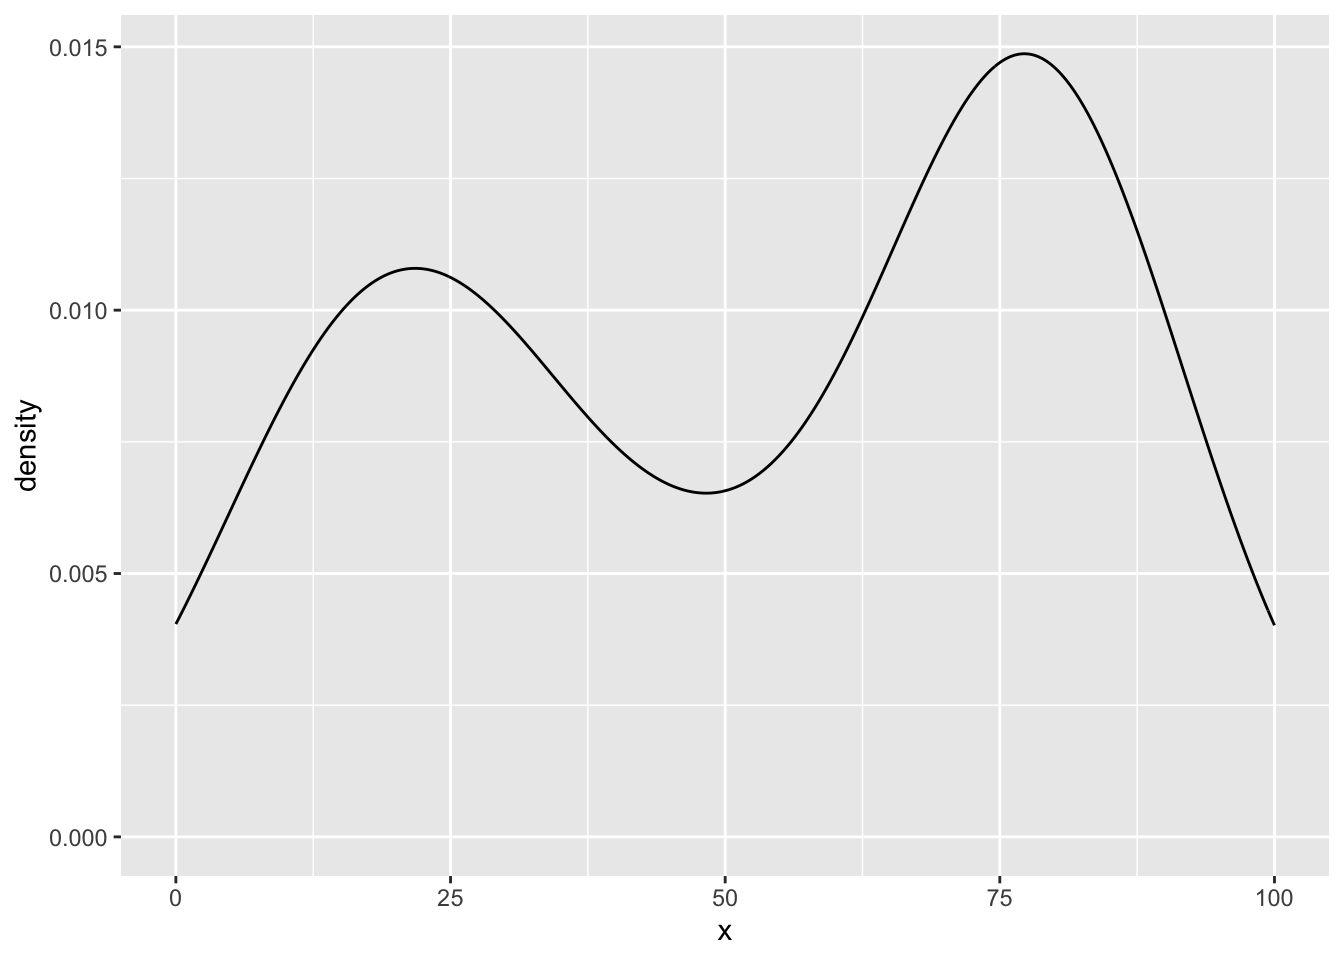
change things once in the function
What if we want to change the output? Since we are using a function, we make changes once which will then be deployed to each new use of the function. Let’s change the base theme used for the plot and add some color:
my_density_plotter <- function(df, x) {
  # create a simple density plot
  ggplot(df, aes(x = x)) +
    geom_density(alpha = .5, fill = 'dodgerblue', color = 'black') +
    theme_bw()
}
And the changes are now live!
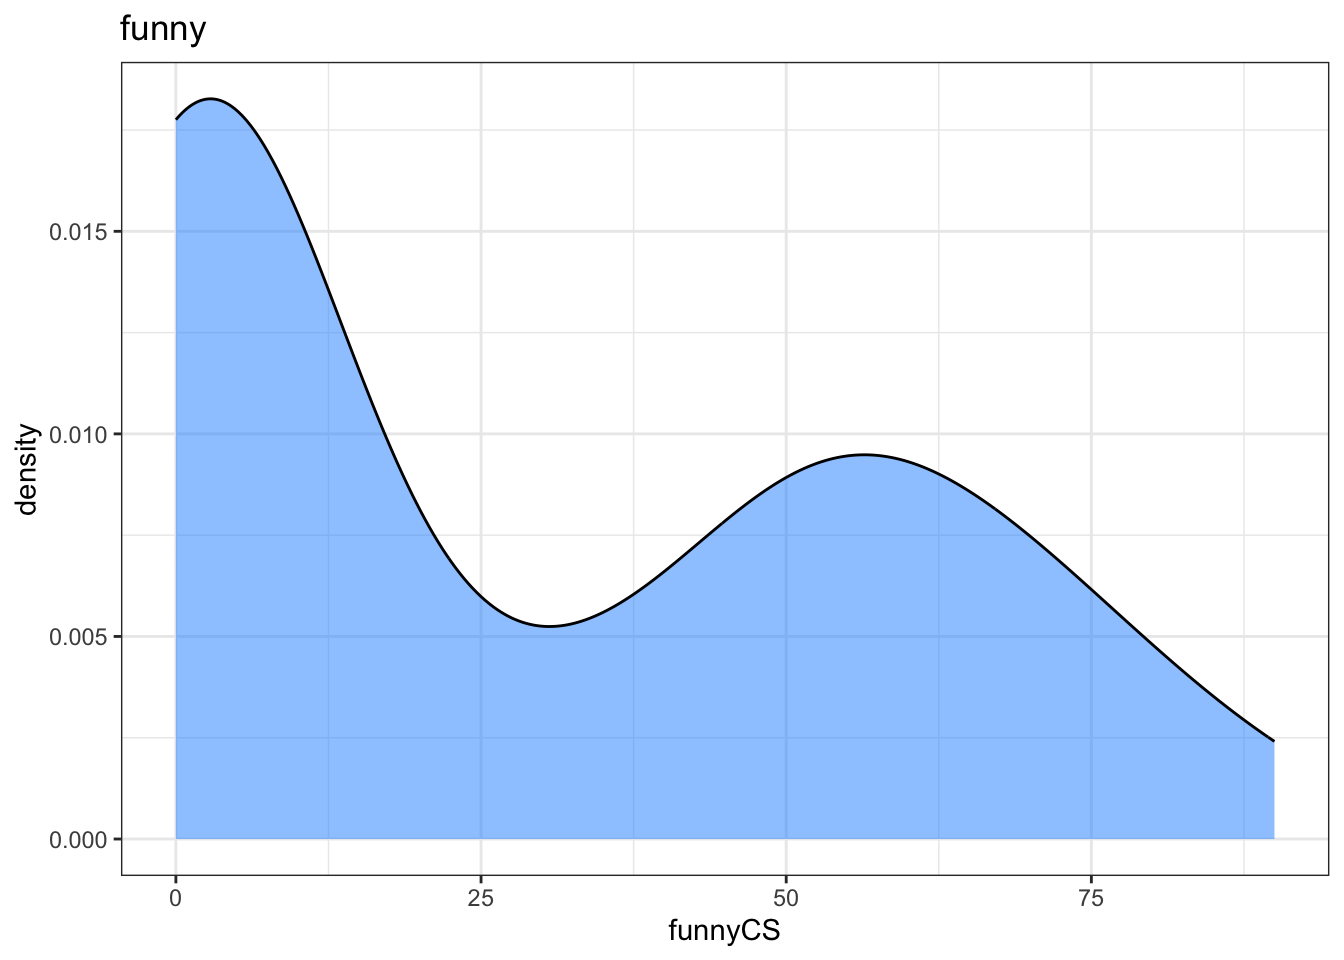
my_density_plotter(dat, dat$funnyCS)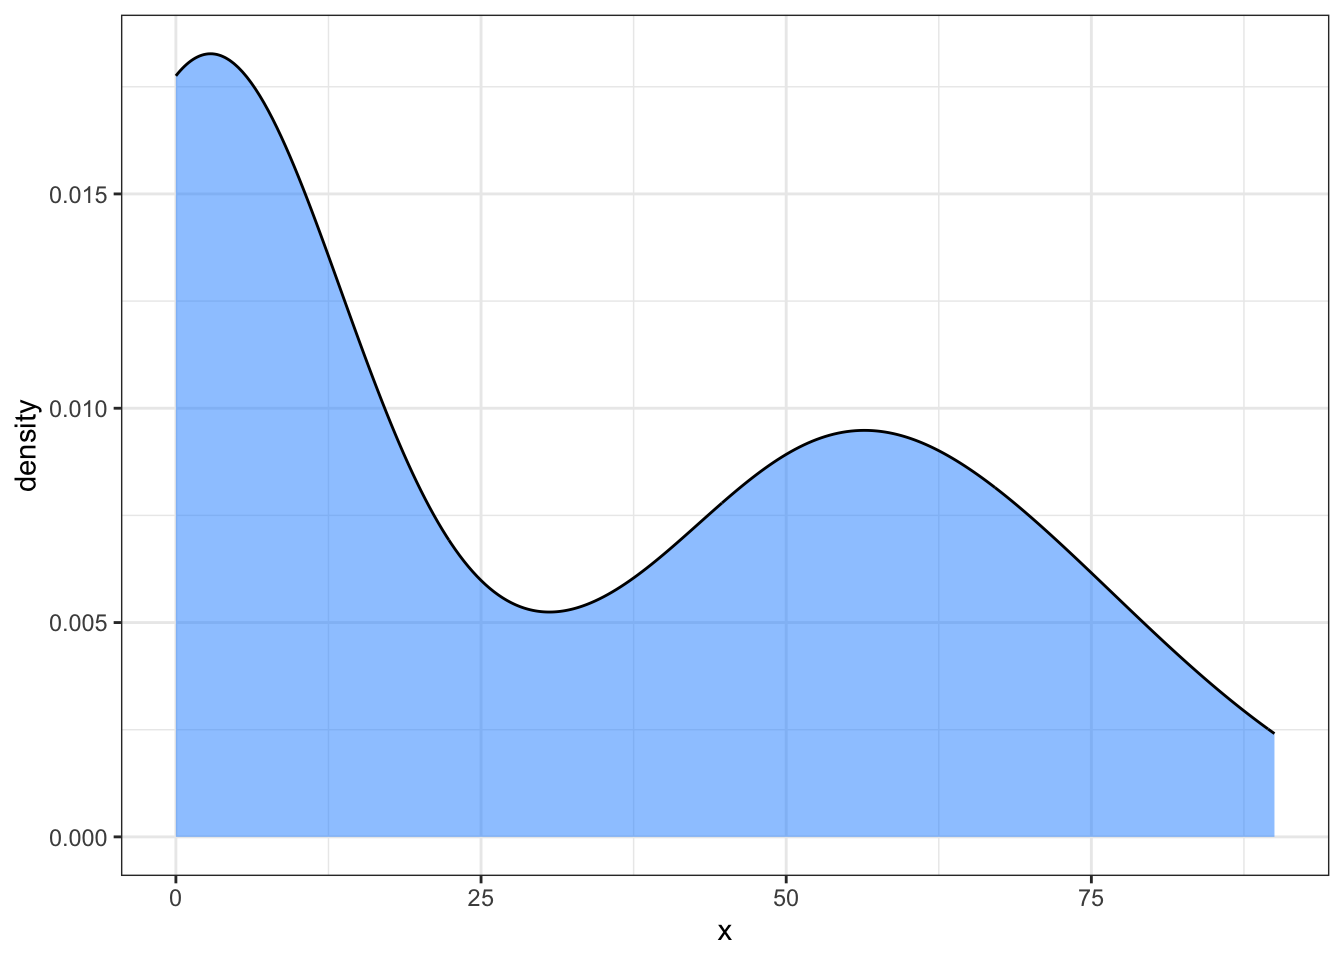
what else can we add?
We could do any number of additions to help the plots become more meaningful, such as providing arguments for axes and title labels:
my_density_plotter <- function(df, x, xlab = '', title = '') {
  # create a simple density plot
  ggplot(df, aes(x = x)) +
    geom_density(alpha = .5, fill = 'dodgerblue', color = 'black') +
    theme_bw() +
    labs(x = xlab, title = title)
}
And it keeps going…
my_density_plotter(dat, dat$funnyCS, xlab = "Funny Ratings", title = 'Funny ratings for headlines')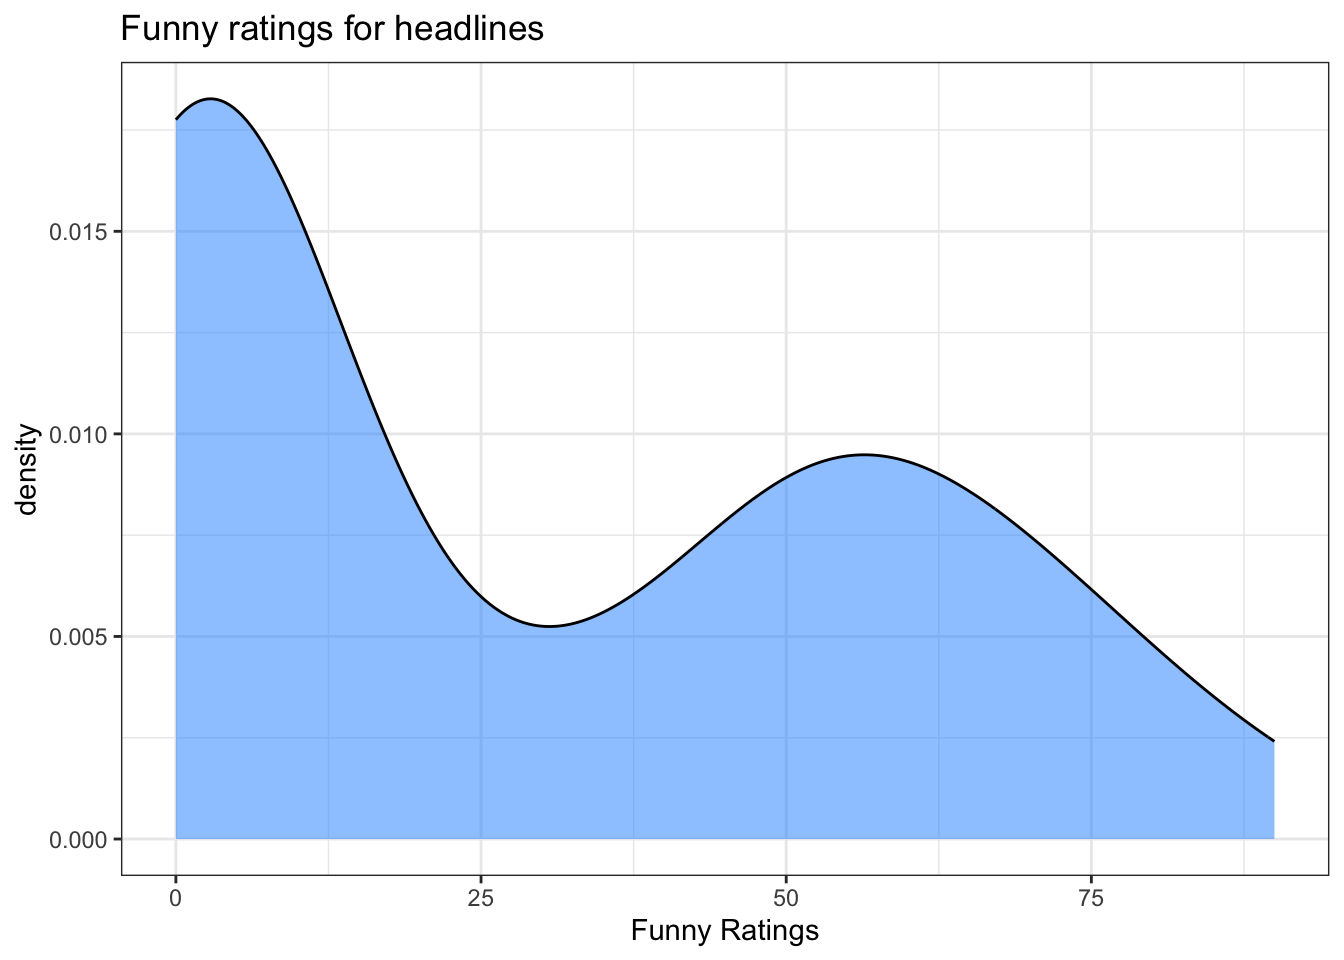
Because we provide default empty string arguments, we could actually run the function without giving it an xlabel or title. The labels will be the emptry strings now:
my_density_plotter(dat, dat$funnyCS)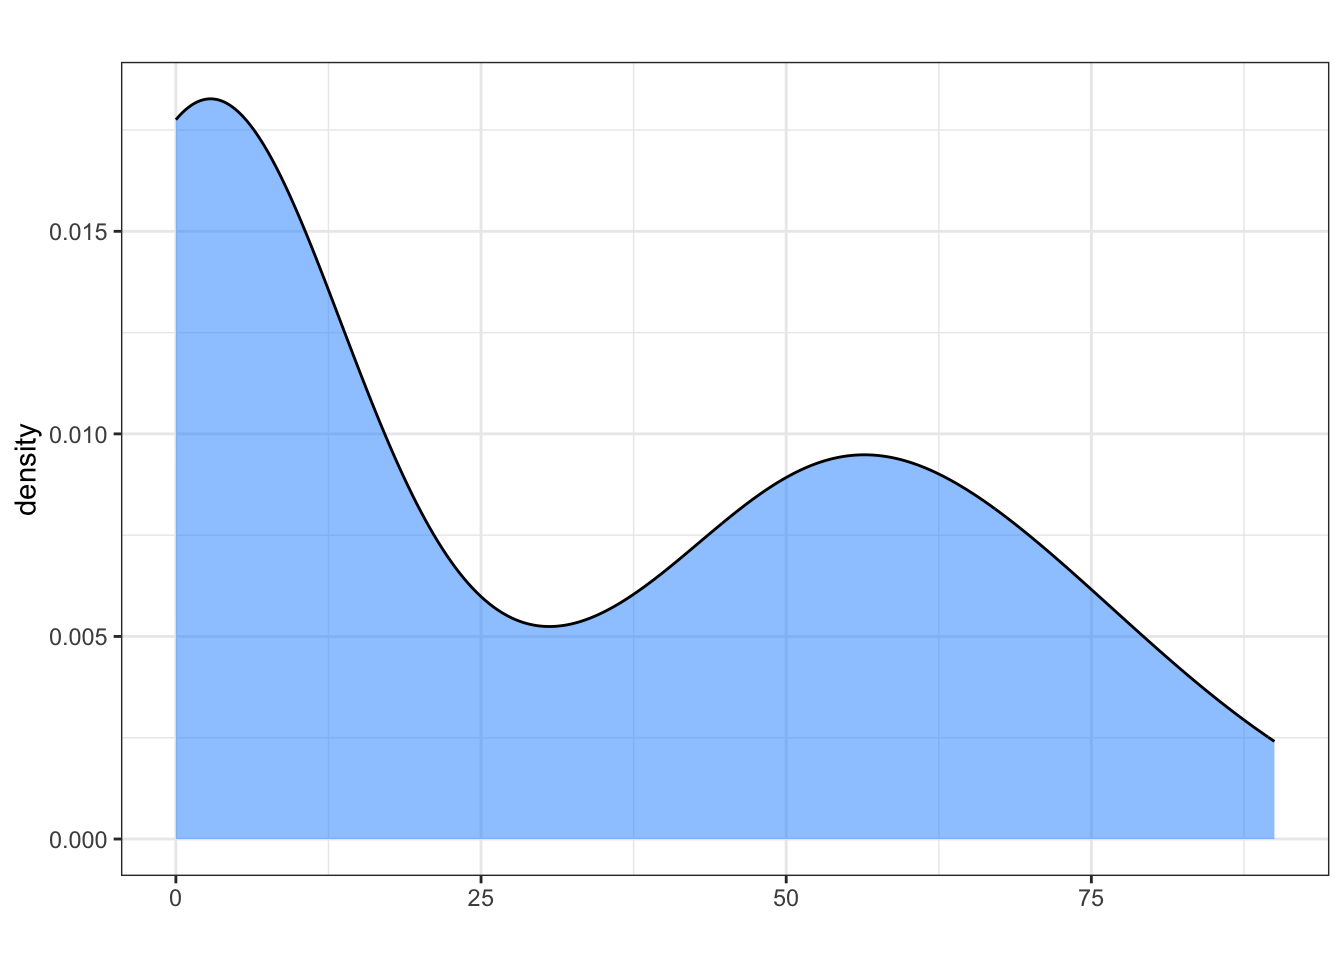
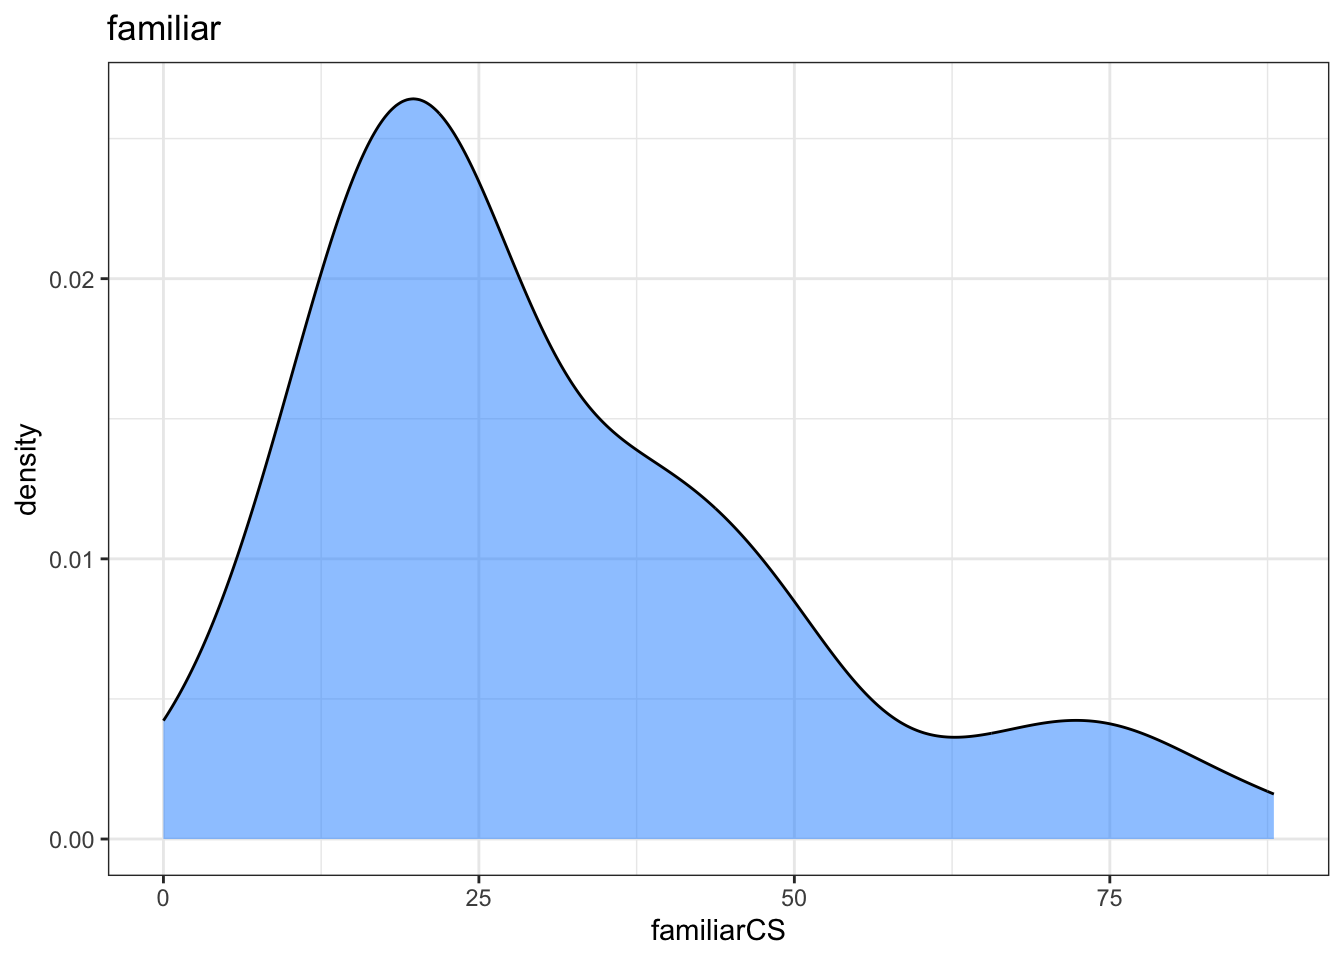
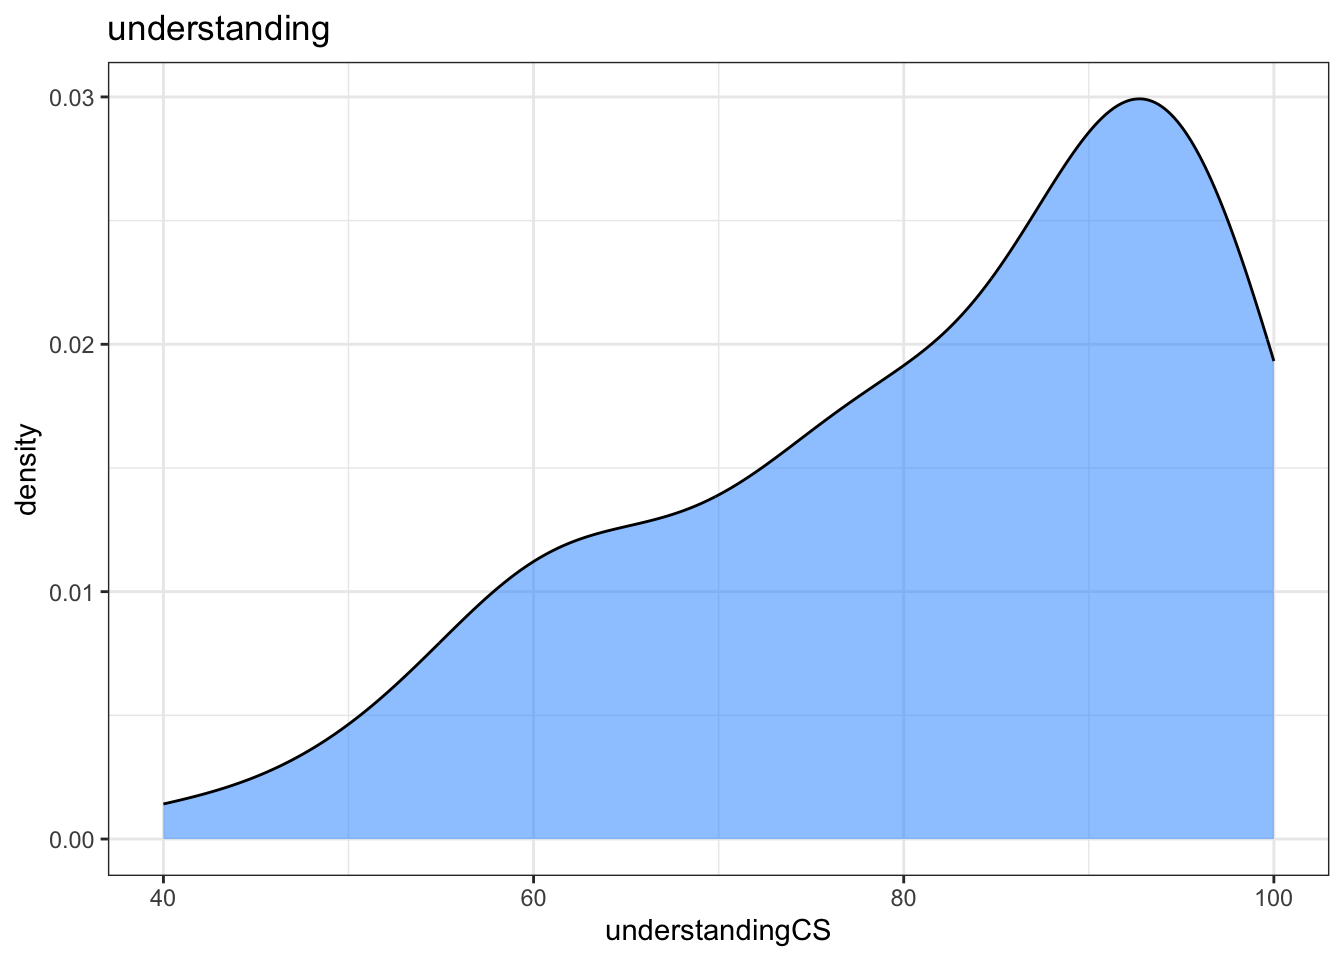
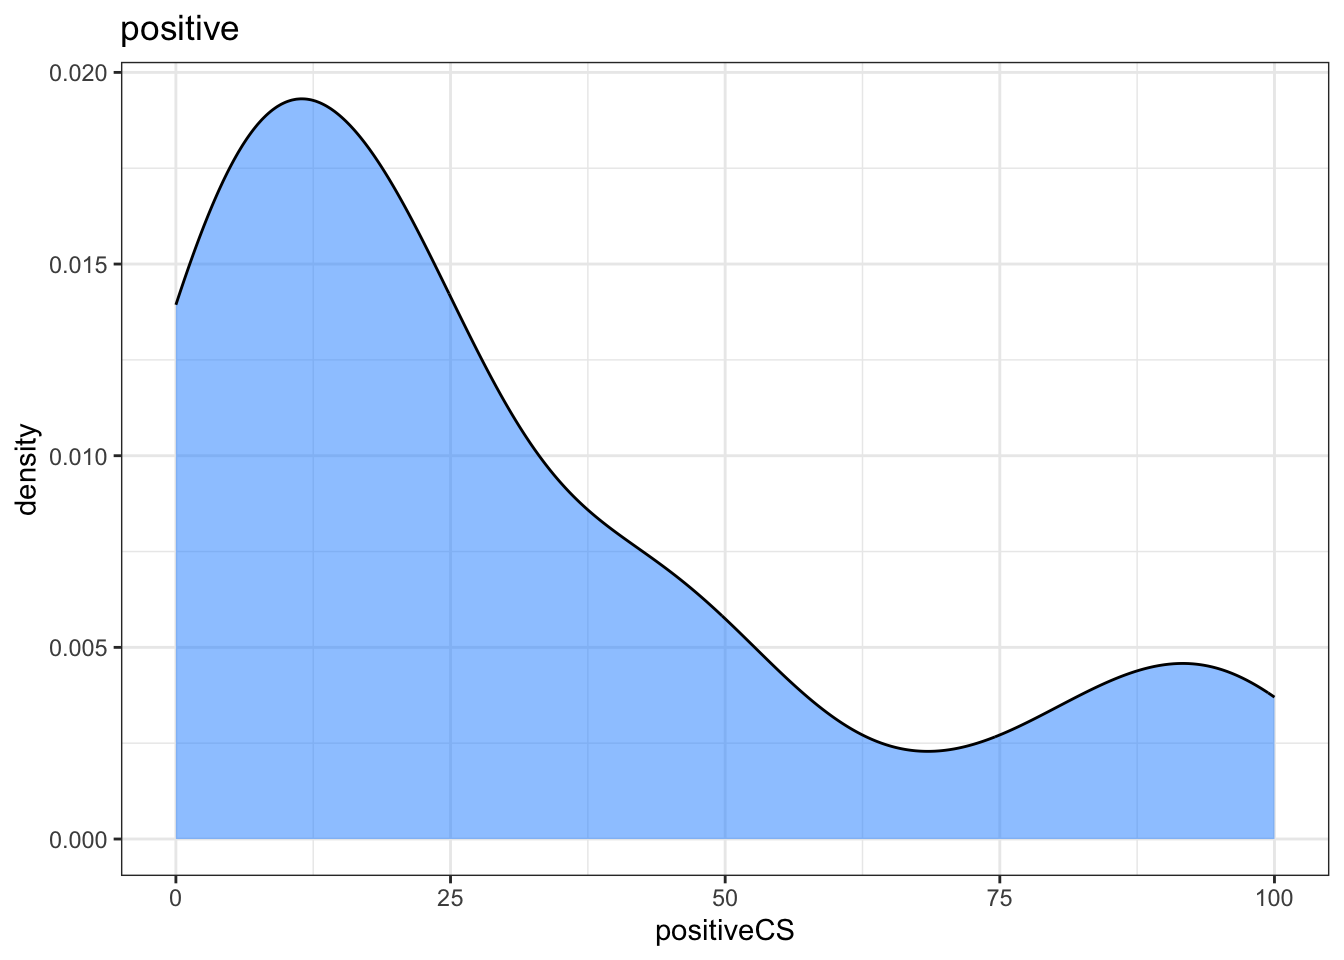
function to do a function
This is all well and good but honestly isn’t too much of an improvement upon using the ggplot() functions directly. But we can start adding more control by looping through or applying the function more automatically.
Below I use a for loop within the function, bracket notation, and other stuff. If you haven’t understood this stuff yet, that’s ok! I just wanted to show you that using functions and variables makes repeating tasks a lot easier in R. Technically, using a for loop is bad practice in R, but this will do for our purposes. We will continue exploring more advanced functions and control as we go on.
control_func <- function(df){
  # obtain list of column names from the df
  columns = colnames(df)
  # for each column that is NOT filename:
  for(column in columns){
    if(column != 'filename'){
      # create the plot
      # use print so we get all the plots
      print(my_density_plotter(df,
                              # bracket instead of $ notation
                              df[[column]],
                              # make x axis column name
                              xlab = column,
                              # string splitting for title
                              title = str_sub(column,
                                               start = 1,
                                               end = -3)))
    }
  }
}control_func(dat)